OneEye
100 W
I believe the ~$17/cell was an at-factory quote on 1,000 minimum order. Extremely doubtful we will see a price like that for delivered small quantities.
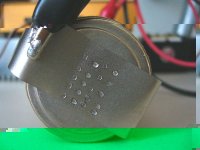
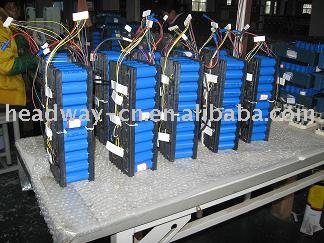
docnjoj said:Leaves us with about 300-350 plus cms per pack. Not that bad for good quality cells! They seem to have decent solder tabs for those of us who solder packs together.
David
Don't forget to save the data as either "text" or "csv". That way it's not bound to any particular version of a spreadsheet.Doctorbass said:Safe, your graph data will come soon!
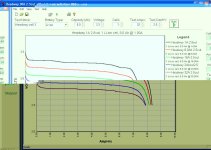
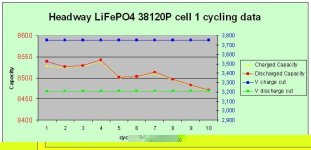
Doctorbass said:For now here are the first 10 cycles of the cell 1 at 5A disch cut 2.9V 10A charg 10 min pause between cycles
...
By taking account that li-ion cells capacity is based on how many cycles it can reach before (dropping) to 80% of the original capacity, that would mean that 1% loss for 10 cycles= 200cycles for 20% drop capacity.... BUT.. that cell is brand (new) and need to (stabilize) and we can't make conclusion at this time with only 13 or 14 cycles total.
")
wanders said:Doctorbass said:For now here are the first 10 cycles of the cell 1 at 5A disch cut 2.9V 10A charg 10 min pause between cycles
...
By taking account that li-ion cells capacity is based on how many cycles it can reach before (dropping) to 80% of the original capacity, that would mean that 1% loss for 10 cycles= 200cycles for 20% drop capacity.... BUT.. that cell is brand (new) and need to (stabilize) and we can't make conclusion at this time with only 13 or 14 cycles total.
Great work, Doc - I love the scientific approach
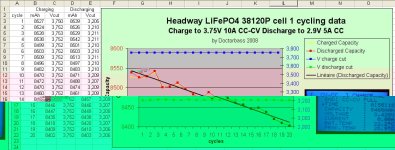
Your chart implies charge cutoff at ~3.75 V and discharge cutoff at 3.2 V, while your text states a discharge cutoff at 2.9V. If you were truly using the chart voltage markers, the capacity given would be excellent. Could you elaborate?
Also, since the cells are rated at 8AH, you are still working in the excess capacity regime. As you know, due to the nature of the electrochemistry of the electrodes in a cell, there is some "normalizing" that takes place when the cells are new. As you have said, it is a little early to estimate the cycle lifetime of these cells.
Thanks again for the excellent work!
Willie
Jeremy Harris said:Doc,
Do you think that these cells will be OK for high rate of discharge operation?
I'm thinking of a 16 series, 3 parallel, pack, 48V @ 30Ah with max current of around 120 to 150 amps, continuous current of around 50 amps or so.
Jeremy
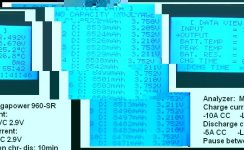
Doctorbass said:I just finished the lasts 10 cycles for a total from now of 20 complete cycles. here are the data:
safe said:Doctorbass said:I just finished the lasts 10 cycles for a total from now of 20 complete cycles. here are the data:I'm glad you posted your results, but I was looking for more than one cell. The idea was to spot the differences between cells and log that data so that I could do some balancing analysis. What I'm really looking for is the moment-to-moment drain performance for each cell in a single cycle... but multiple cells...
I will take what I can get...Doctorbass said:Be patient Safe!
Doctorbass said:I just finished the lasts 10 cycles for a total from now of 20 complete cycles. here are the data: