Overclocker
10 kW
Here's a good way to check by matching the discharge curves from here: http://lygte-info.dk/review/batteries2012/Common18650comparator.php
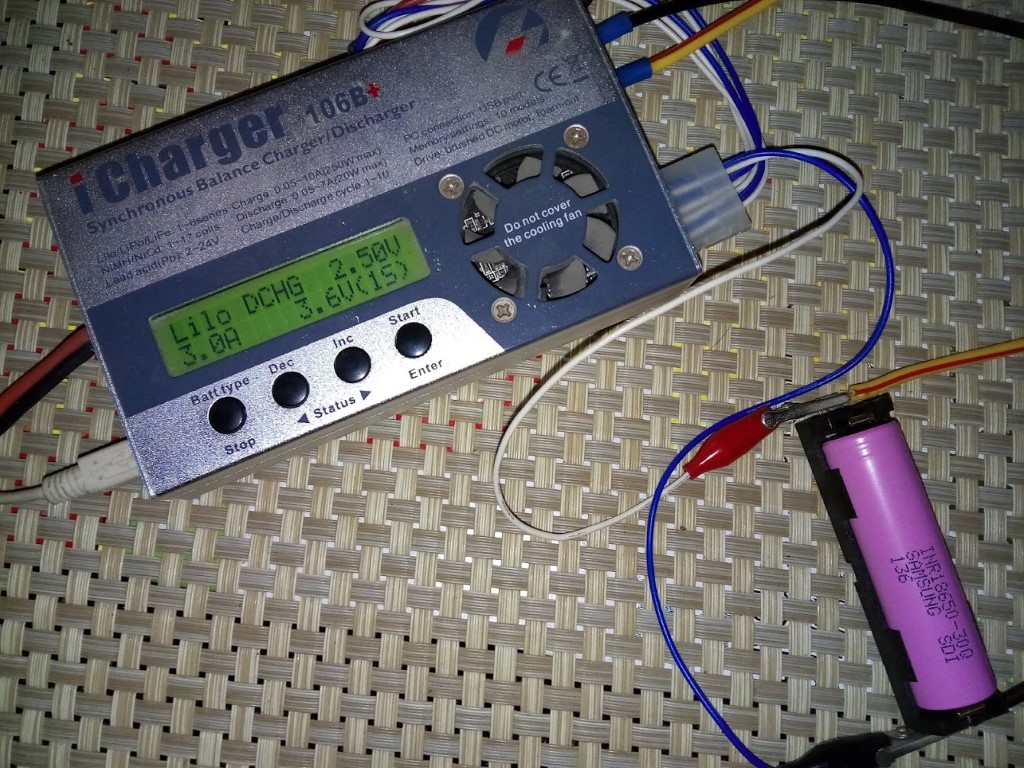
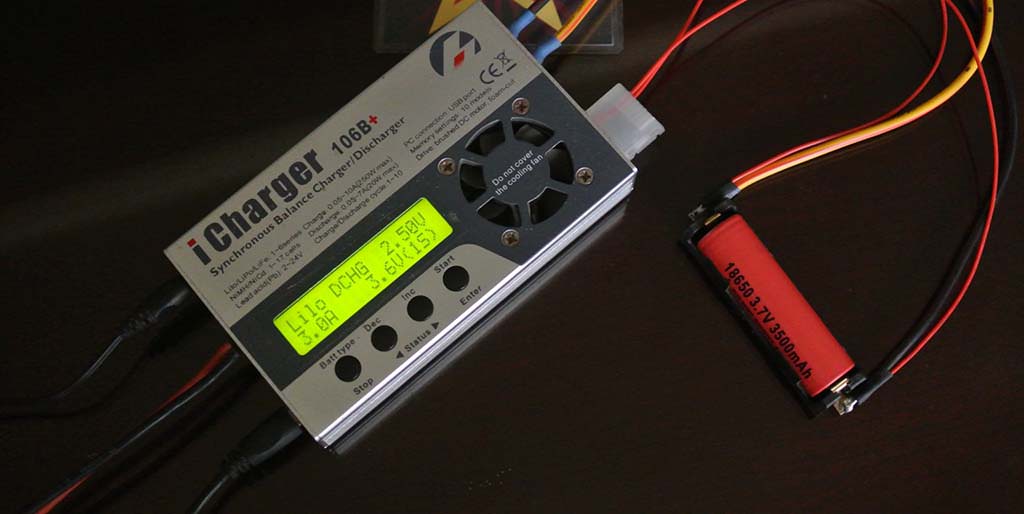
Obviously this requires a way to graph the discharge curve of your test cell, in this case the Samsung 30Q. Shown here is the iCharger 106B+ via USB (to Logview). Using sense wires to the balance port is recommended.
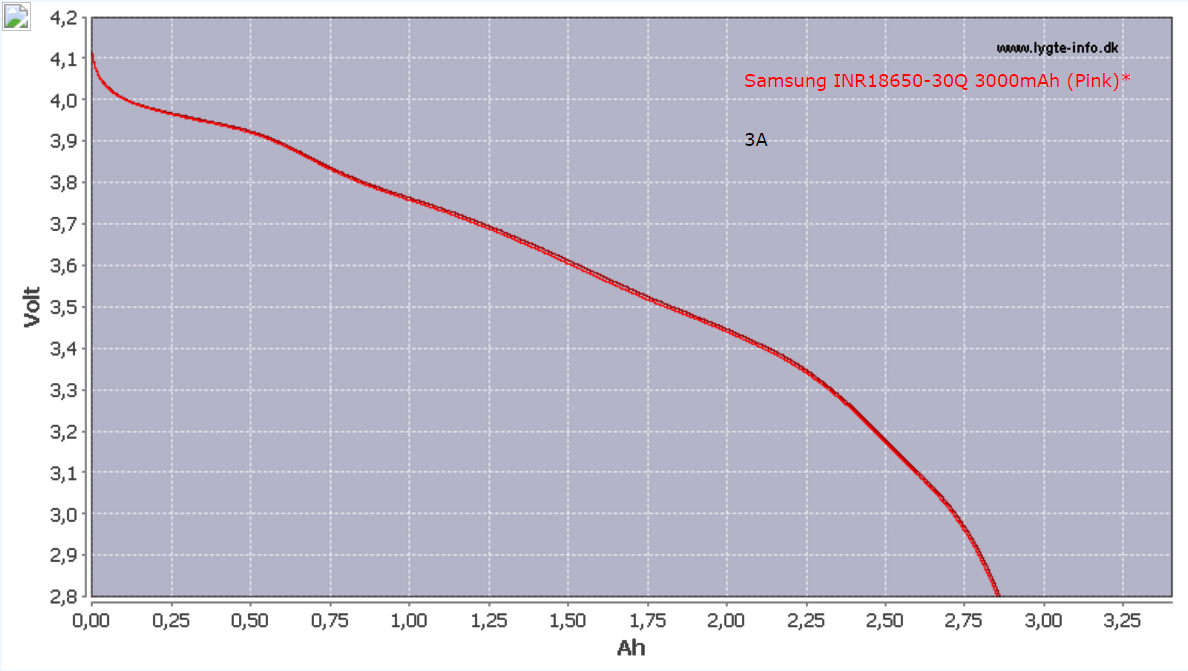
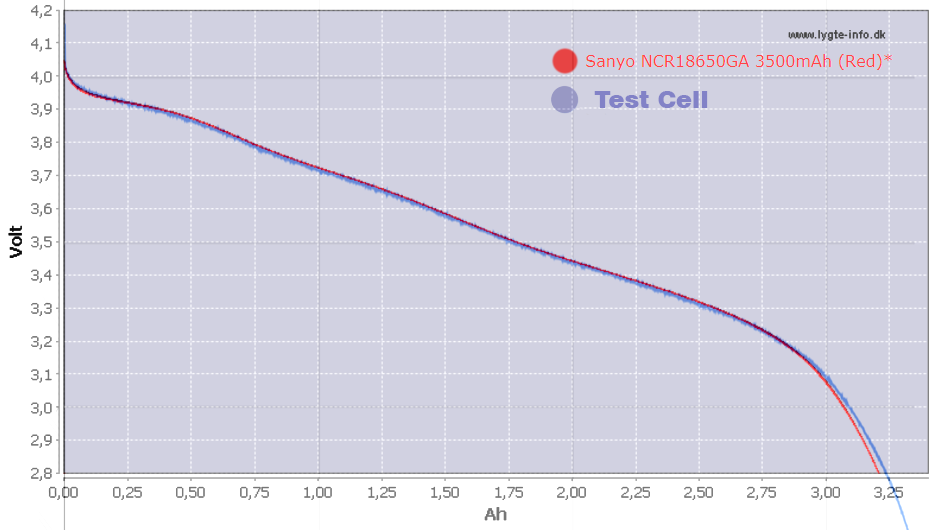
(reference 30Q curve from lygte-info.dk)
Now log the data on Logview. Then plot the data as voltage vs capacity on Excel or whatever. Then stretch the image to match the gridlines on the reference graph:
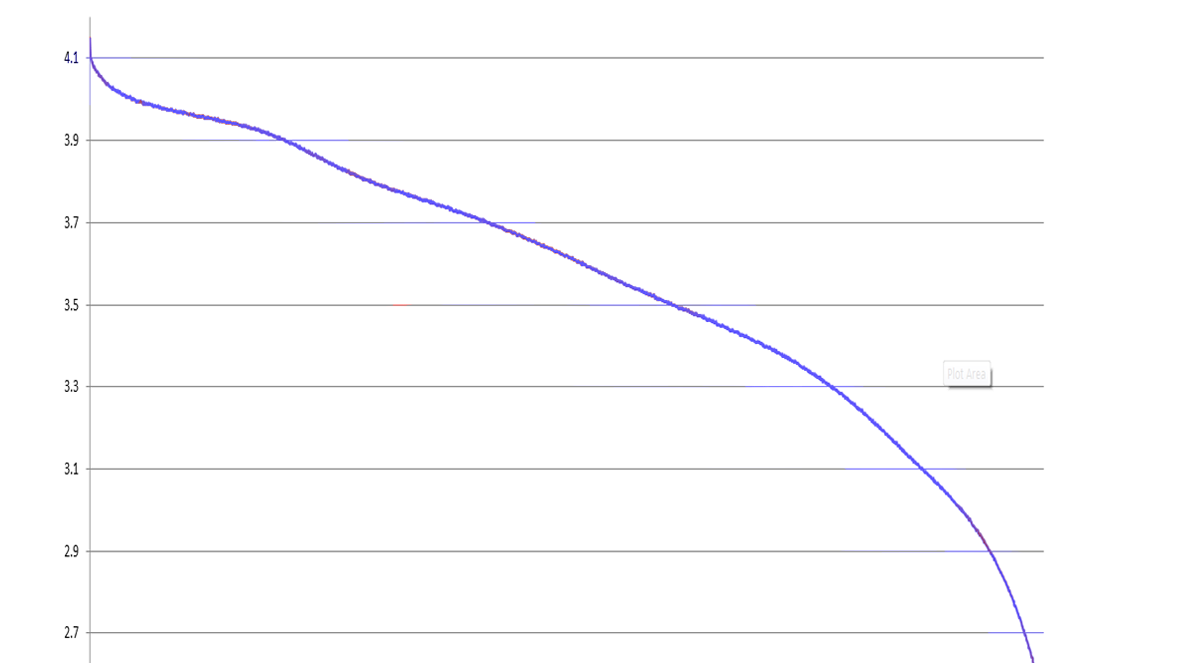
Then combine the images:
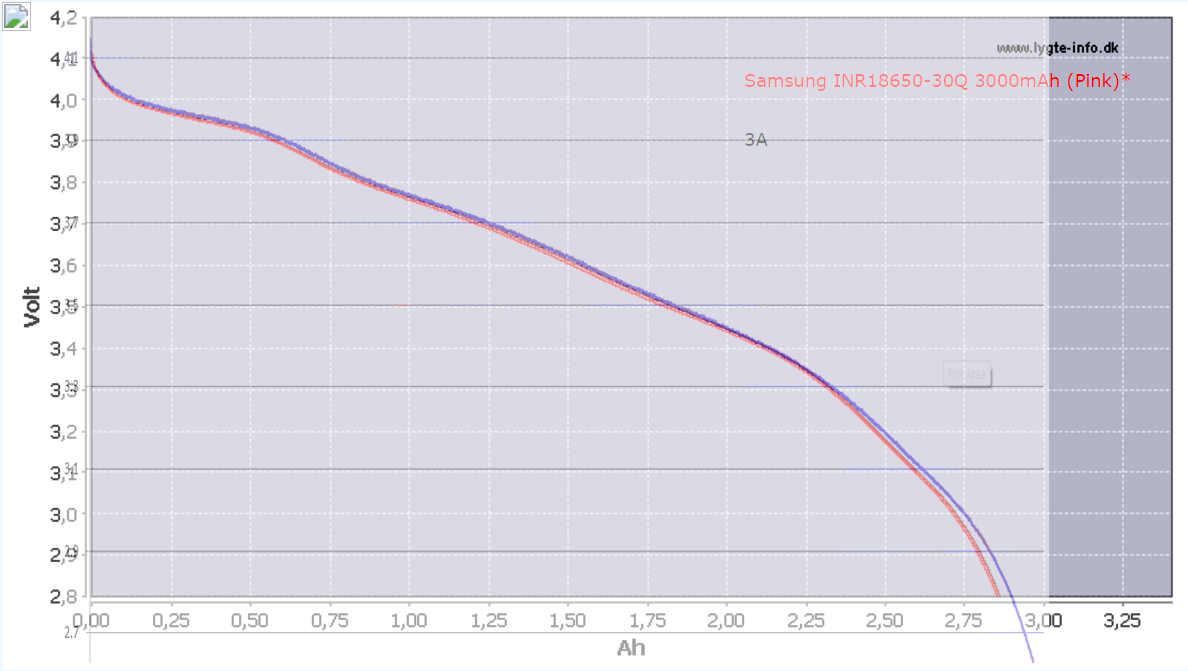
Here my test cell performs just slightly better but it does follow the reference curve extremely well, even down to the characteristic "hump" near the 3.9v mark. So we can conclude that it's legit.
[Moderator edit to fix title]
Obviously this requires a way to graph the discharge curve of your test cell, in this case the Samsung 30Q. Shown here is the iCharger 106B+ via USB (to Logview). Using sense wires to the balance port is recommended.
(reference 30Q curve from lygte-info.dk)
Now log the data on Logview. Then plot the data as voltage vs capacity on Excel or whatever. Then stretch the image to match the gridlines on the reference graph:
Then combine the images:
Here my test cell performs just slightly better but it does follow the reference curve extremely well, even down to the characteristic "hump" near the 3.9v mark. So we can conclude that it's legit.
[Moderator edit to fix title]